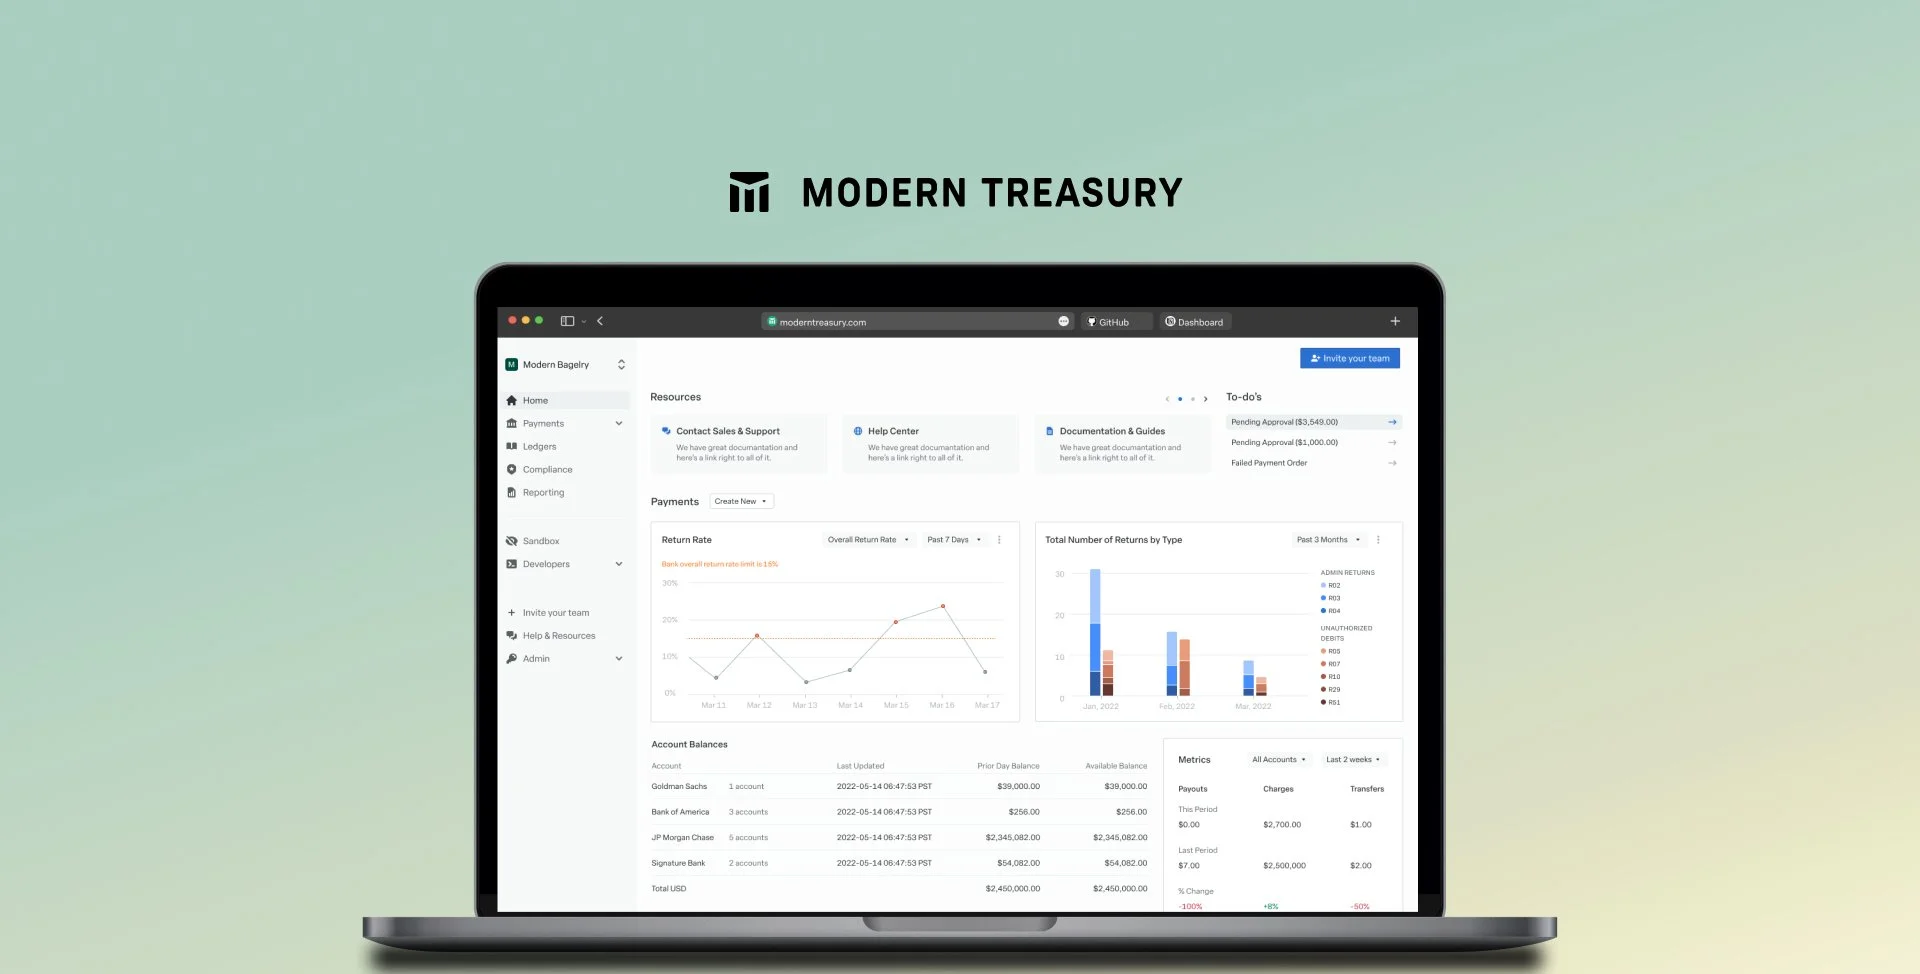
Modern Treasury Payment Dashboard
Rethinking Reporting: Introducing simple data visualization to drive value
Modern Treasury set out to build a Stripe-like reporting dashboard — a 3–6 month initiative. But through user insight and lean execution, I helped ship a simpler, more impactful solution in just 4 weeks.
Role: Lead Product Designer
Team: 1 PM, 2 Engineers, myself
Timeline: 4 weeks
Stage: Post-MVP
Type: UX/UI Design, Product Strategy, Systems Thinking
🎢 The challenge
The users were struggling to make sense of their long list of payment data from their payments page.
Users were downloading data and manually building reports using external tools - like Excel, Tableau or Looker.
Leadership wanted a full-fledged reporting capability like Stripe, which estimated 3-6 months engineering time
No existing in-product data visualization infrastructure
🧐 My roles and goals
Lead user discovery to validate what users truly needed
Propose a lean, high-impact solution
Lay the groundwork for future data visualization
Partner with engineering to execute quickly and scalably
💡Insights from Users
Through quick interviews and usability testing, we learned:
Users didn’t need full reporting — they just wanted:
✅ Return rate trends
✅ Tracking by type (e.g., vendor, category, status)Pain came from lack of clarity, not missing features
✨ The Solution
Instead of a new tool, I proposed surfacing the most valuable metrics directly within the existing payments page.
What I did:
Created low-fidelity and high-fidelity mockups
Selected a customizable charting plugin with engineers
Designed a reusable, accessible color system for data viz
Scoped MVP visuals that could be shipped in 4 weeks
🚀 Results & Impact
✅ ~30% engagement on the payments page (in 2 weeks)
✅ Postponed the full report building workflow— saving 3–5 months of engineering time
✅ Visualization system was reused for future product offering from the beginning - example is: the Compliance Dashboard
🌱 Lasting Contributions
Introduced the company’s first in-product data visualizations
Designed a reusable visualization framework
Set a precedent for lean, user-led iteration over large speculative builds
🧠 What I Learned
Strategic design doesn’t always mean “more” — it means focus
User validation can shift product priorities and save months
Investing in reusable systems pays off fast, even in early-stage products